How WhatsApp Bot Help for Enterprise Business?
The WhatsApp bot website needs to be designed to showcase the prospective customers on the use case of a WhatsApp bot integration in their business. There will be various domain target customers to sell the bot with the required features.
In the website, we will highlight specific domains and their benefits provided by the bot integration.
Why Build WhatsApp Bot?
A chatbot is an Artificial Intelligence software that can assimilate conversation with a user and reciprocate with the best answer available for the Business. This Automation prohibits Businesses from giving the same responses again to users.
E.g User/Customer needs the information of the product, a brochure can be passed Automatically with all information. The Key benefits of Chatbot are they are always in good mod J (as no human intervention), they are fast to respond real-time, it increases our reach to address many customers at the same time (Without human interaction), Cost-efficient.
Why Should We Use WhatsApp Chatbot?
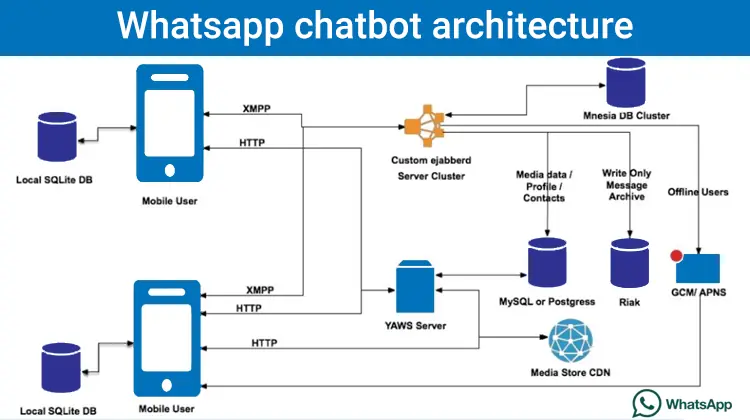
Building an Enterprise chatbot involves high configuration servers, real-time efficiency, high storage, high software development cost and once they are built, Enterprise needs the users to use the Enterprise Chatbot and interact with company.
CAC (Customer Acquisition Cost) and CPI (Cost Per Install) for Mobile Apps range from $2-$10 and it’s empowered by Mobile app marketing and multiple Business models to get a space in end users Mobile devices.
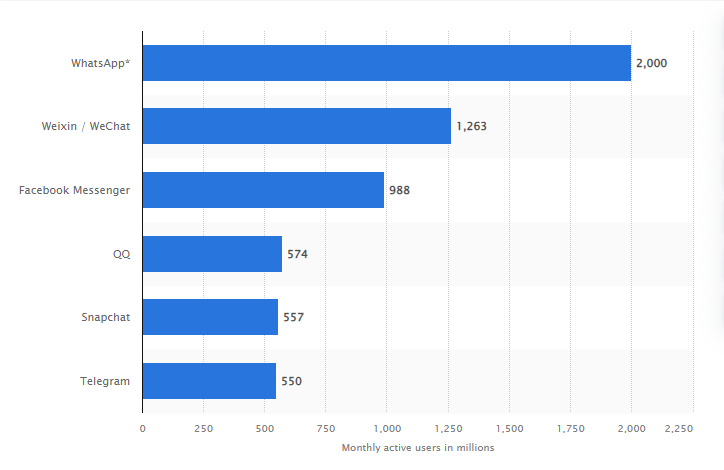
Hence, we use most widely used Mobile App across the globe having over 2.6 Billion Users using the service of WhatsApp every day. The Statistics proves WhatsApp is the comparatively most widely used apps across the industry.
WhatsApp Bot for Various Industries
WhatsApp bot can be used as a digital marketing platform from a small business to a big corporate. To give a realistic purview, we have listed a few industries and the benefits of using Bots in them
- Travel Industry
- Healthcare Services
- Entertainment Industry
- Agriculture Industry
- Education Sector
- Services Industry
There are various ways HealthCare Industry can benefit from WhatsApp chatbot in Customer acquisition, retention, customer satisfaction, and continued support and interaction with customers.
In our next article, we will share more benefits and usage of other industries, stay tuned! To know more about WhatsApp chatbots and Enterprise apps development contact us at contact@itoneclick.com